We Converted 15 Real Images to WebP: Here’s What Actually Got Smaller
We stopped quoting the “25–34% smaller” averages and ran our own test: 15 real photos, screenshots, and logos through WebP at quality 80. The median file shrank 63%, the set went from 6.1 MB to 1.5 MB, and one image got bigger. Here are all the numbers.
Every WebP guide repeats the same line: “WebP images are about 25–34% smaller than JPEG.” That figure comes from a Google study, and it is fine as far as it goes — but it is an average from one curated test set, and it never told us what this converter does to real files. So we stopped quoting it and ran our own test.
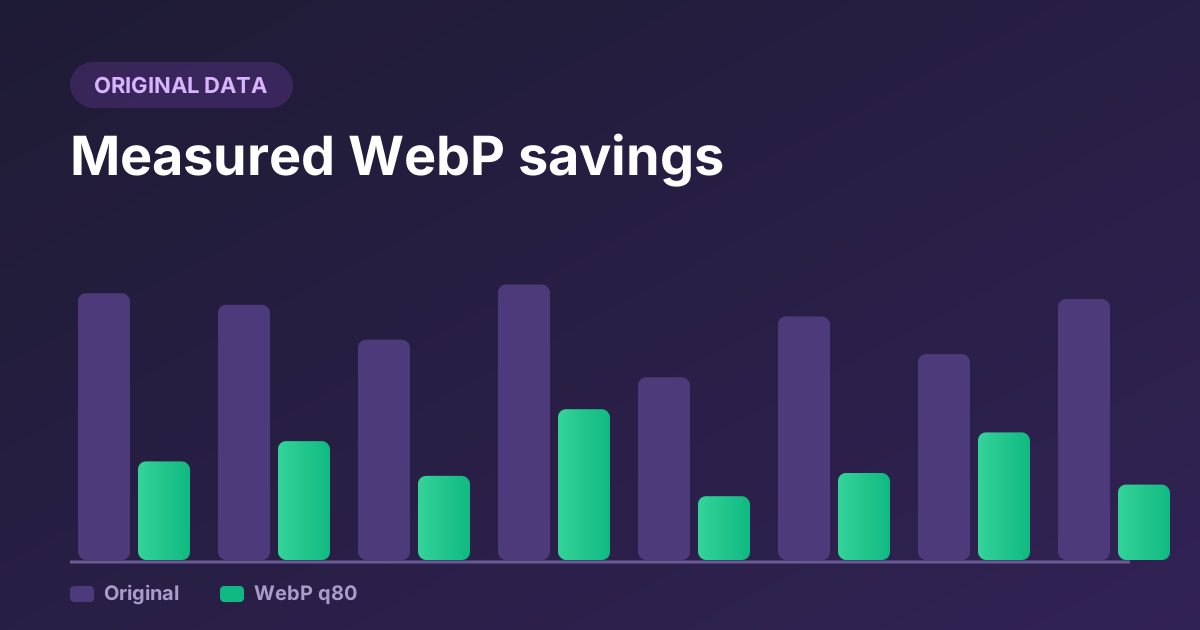
We took 15 images we actually had on hand — photographs, screenshots, and logos — pushed each one through the same WebP encoder our converter uses, and weighed every byte before and after. The short version: the median file shrank by 63%, the whole set went from 6.1 MB to 1.5 MB, and pushing one file to quality 100 made it bigger than the JPEG it started as. The averages you read elsewhere hide a lot, and the spread is the interesting part.
How we tested
The method is deliberately boring, because boring is what makes it repeatable.
- The images. Ten photographs saved at a web-typical 1600 px wide, two of those same photos re-exported as PNG (the mistake we see constantly), and three project logos with transparency. A deliberate mix, not a cherry-picked one.
- The encoder. libwebp — the same library behind WebP conversion in Chrome — at quality 80. No resizing; each image was converted at its original dimensions, exactly like dropping it into the tool with resize left off.
- The measurement. Raw file size on disk, before and after. “Saved” is simply
(original − webp) ÷ original. - What we did not do. No perceptual quality scoring (SSIM/Butteraugli), no per-image quality tuning, no stripping of metadata beyond what the encoder does by default. Adding any of those would improve the results and make them less representative of what people actually do.
One caveat up front: a browser's WebP encoder and a server's can differ by a percent or two on any single file, and your source quality matters enormously — a JPEG already crushed to quality 60 has far less left to give. Treat these as a realistic guide, not a guarantee.
The full results table
Sorted by image type, then by how much each one shrank. Nothing left out — including the photo that barely moved.
| Image | Type | Original | WebP q80 | Saved |
|---|---|---|---|---|
| Photo exported as PNG #1 | PNG photo | 1,294.6 KB | 74.8 KB | 94% |
| Photo exported as PNG #2 | PNG photo | 2,195.1 KB | 169.1 KB | 92% |
| JavaScript logo | Logo (PNG) | 10.1 KB | 2.1 KB | 79% |
| PHP logo (transparent) | Logo (PNG) | 23.8 KB | 7.5 KB | 69% |
| React logo (transparent) | Logo (PNG) | 40.5 KB | 14.3 KB | 65% |
| Analytics dashboard | Photo (JPEG) | 206.8 KB | 66.2 KB | 68% |
| City lights at dusk | Photo (JPEG) | 160.3 KB | 57.9 KB | 64% |
| Product website mockup | Photo (JPEG) | 201.9 KB | 74.8 KB | 63% |
| Code on a dark screen | Photo (JPEG) | 347.3 KB | 142.7 KB | 59% |
| Retro gaming, neon | Photo (JPEG) | 206.0 KB | 86.3 KB | 58% |
| Editor / code closeup | Photo (JPEG) | 209.2 KB | 93.2 KB | 55% |
| Circuit board macro | Photo (JPEG) | 325.5 KB | 153.1 KB | 53% |
| Camera on a desk | Photo (JPEG) | 350.1 KB | 169.1 KB | 52% |
| Team at a desk | Photo (JPEG) | 309.6 KB | 160.4 KB | 48% |
| Data-centre servers | Photo (JPEG) | 341.9 KB | 222.4 KB | 35% |
| All 15 combined | 6,222.6 KB | 1,494.0 KB | 76% |
Median 63% • mean 64% • range 35–94% • 15 of 15 images got smaller. All conversions at quality 80, original dimensions.
Savings by image type
Aggregating the same data by category makes the pattern much easier to act on. If you only have time to fix one class of image on your site, this table tells you which.
| Source type | Count | Median saving | Range | Priority |
|---|---|---|---|---|
| Photograph saved as PNG | 2 | 93% | 92–94% | Fix first — enormous, easy win |
| Logo / graphic with alpha | 3 | 69% | 65–79% | High — transparency survives intact |
| Photograph already JPEG | 10 | 58% | 35–68% | High — usually the bulk of page weight |
| High-noise photograph | — | ~35% | worst case above | Moderate — still worth doing |
What the spread tells you
Photos saved as PNG are the easy money
The two biggest wins, by a mile, were ordinary photographs that someone had exported as PNG. A 2.1 MB PNG collapsed to 169 KB — a 92% cut — and the visual difference is invisible at normal viewing size. PNG is a lossless format built for graphics with sharp edges and flat colour; forcing a million-colour photograph through it produces an enormous file that buys you nothing. If you remember one thing from this test: never ship a photograph as a PNG. The compression fundamentals guide explains exactly why the mismatch is so costly.
Already-JPEG photos still gave up half their weight
This is the case people doubt: “my images are already JPEGs, what's left to squeeze?” Quite a lot. The ten JPEG photos shrank a median of 58%, roughly double the headline number usually quoted for WebP.
The variation is the honest bit. The flat analytics dashboard, with its big blocks of solid colour, gave back 68%. The noisy, high-detail data-centre shot — thousands of cables and blinking lights, the kind of texture compressors hate — managed only 35%. Detail and noise are the enemy of compression, in any format. If a particular image refuses to shrink, look at how much fine random texture it contains before you blame the encoder.
Logos with transparency convert cleanly
All three logos kept their transparent backgrounds and still dropped 65–79%. That matters because the usual reason people stay on PNG for logos is the alpha channel — and WebP carries it across without complaint.
One nuance worth knowing: for very simple flat-colour logos, lossless WebP can sometimes beat the lossy quality-80 result. Our browser tool uses lossy mode, which is the right default for the photos that make up most of a page's weight, but it is worth testing both on a pure-vector-style logo — or shipping it as SVG and skipping the raster question entirely.
The one that got bigger: why quality 100 backfires
We kept pushing one photo — the 350 KB camera shot — up and down the quality slider to find where the trade lives. The top end surprised even us.
| Quality setting | WebP size | vs. the 350 KB JPEG |
|---|---|---|
| 100 | 608.6 KB | 74% larger |
| 90 | 318.2 KB | 9% smaller |
| 80 (default) | 169.1 KB | 52% smaller |
| 75 | 130.5 KB | 63% smaller |
| 60 | 97.5 KB | 72% smaller |
| 40 | 67.9 KB | 81% smaller |
At quality 100 WebP tries to preserve every last artifact already baked into the JPEG — including the JPEG's own compression noise — and the file balloons to nearly double the original. This is exactly the trap the converter warns you about when a result comes out larger. We took this further in a dedicated quality ladder test across four image types.
The practical rule
Start at quality 80. If the converter tells you the WebP came out larger than your source, the original is already heavily compressed — drop to 70 or 60 and convert again. If you find yourself reaching for 100, you have left the zone where WebP helps.
What this means for LCP
On most content pages the Largest Contentful Paint element is an image, and image weight is the most direct lever on how fast it appears. Take the camera shot: as a 350 KB JPEG on a mid-range mobile connection it is a noticeable wait; at 169 KB it arrives in roughly half the time.
Multiply that across a gallery or a long article and you are shaving whole seconds off the load — the kind of change that moves a “needs improvement” LCP into the green. Smaller files are not an abstract nicety; they are the most direct fix for the Core Web Vital that fails most often.
Two caveats keep this honest. Conversion alone will not save you if the image is lazy-loaded, four times larger than its display slot, or sitting behind a slow server. And a 76% byte reduction is not a 76% LCP reduction — connection setup, server response and render time do not shrink with the file.
Reproduce this yourself
You do not have to take our word for any of it. With cwebp from Google's libwebp installed, this reproduces our exact method on your own folder of images:
#!/usr/bin/env bash
# Convert every image in ./src at quality 80 and print the saving per file.
mkdir -p out
total_in=0; total_out=0

for f in src/*.{jpg,jpeg,png}; do
  [ -e "$f" ] || continue
  name=$(basename "${f%.*}")
  cwebp -q 80 -quiet "$f" -o "out/$name.webp"

  in=$(wc -c < "$f")
  out=$(wc -c < "out/$name.webp")
  pct=$(( (in - out) * 100 / in ))

  printf '%-34s %8d B -> %8d B  %3d%%\n' "$name" "$in" "$out" "$pct"
  total_in=$(( total_in + in ))
  total_out=$(( total_out + out ))
done

printf '\nTOTAL %d B -> %d B (%d%% saved)\n' \
  "$total_in" "$total_out" "$(( (total_in - total_out) * 100 / total_in ))"
For a single file, the converter on our home page gives you the same measurement with no install — and the Compare button lets you check that the saving did not cost visible quality.
The honest caveats
Fifteen images is a sample, not a census. The numbers would shift with a different set — more flat illustrations would push the median up, more grainy night photography would push it down. We also measured bytes only: we did not score perceptual quality, so “63% smaller” is a claim about file size, not a claim that every image is visually identical (though at quality 80, on this set, none showed damage we could see at normal viewing size).
The takeaways hold regardless: WebP at quality 80 reliably beats both JPEG and PNG for photographic content, the biggest wins are hiding in mis-saved PNGs, and cranking quality to the maximum is counter-productive. But for the exact saving on the exact file you care about, there is no substitute for converting it and reading the number off the panel.
See the number for your own images
Drop a batch into the converter and it shows the original size, the WebP size, and exactly how much you saved on each file — the same measurement we used for this test. No upload, no guessing.
Convert your images